InTDS ArchivebyPol MarinYour Data Science Visualizations Will Never Be The Same — Plotly & DashUsing Plotly and Dash to create interactive dashboardsOct 24, 20232Oct 24, 20232
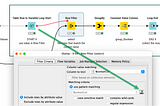
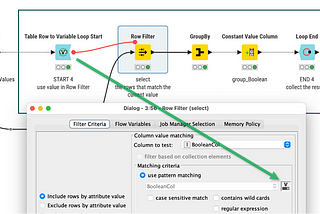
InLow Code for Data SciencebyMarkus LauberKNIME Snippets (4) — Start to Learn KNIMEGet your data science journey started with KNIME — free, open-source, no-code/low-codeMar 21, 2024Mar 21, 2024
InFireBird TechnologiesbyArslan ShahidGenerate PowerPoints using Llama-3 — A first step in automating slide decksAutomating Presentations using LLMs and Python-pptxApr 28, 20242Apr 28, 20242
InLow Code for Data SciencebyMarkus LauberKNIME, Paths and Loops — Automate EverythingThe (few) nodes that will set you on the right path…Apr 4, 20241Apr 4, 20241
InCode Like A GirlbyPetrica LeucaPlot(ly)ing Geo Data From DuckDBHow to analyze and plot geospatial data with DuckDB and PlotlyFeb 19, 2024Feb 19, 2024
InData Visualization, Data Science and PythonbyAlan JonesStreamlit on the Go: Building Python Apps Anywhere with GitHub CodespacesHow a rainy afternoon and a dated tablet sparked a streamlined approach to online app development using GitHub and Streamlit templates.Apr 24, 20241Apr 24, 20241
InTDS ArchivebyAlan JonesMastering Data Visualizaton with Altair’s Grammar of GraphicsTransform data into visualizations with Altair’s powerful library for Python.Feb 27, 20242Feb 27, 20242